

10 May Importance of Graphing Market Trends
I have found graphing to be imperative in showing market trends and emphasizing aspects of an appraisal. I’m thankful to have learned this tool of creating custom graphs a few years ago. Many viewers of the report simply want the nuts and bolts of the appraisal report. Sure we describe the analysis in a paragraph but will a viewer really take the time to read this or simply miss it due to the amount of text in a report? Whether a client is a lender, agent, or homeowner, graphing will convey a message much clearer.
Here are some recent samples of a few graphs I’ve complete.
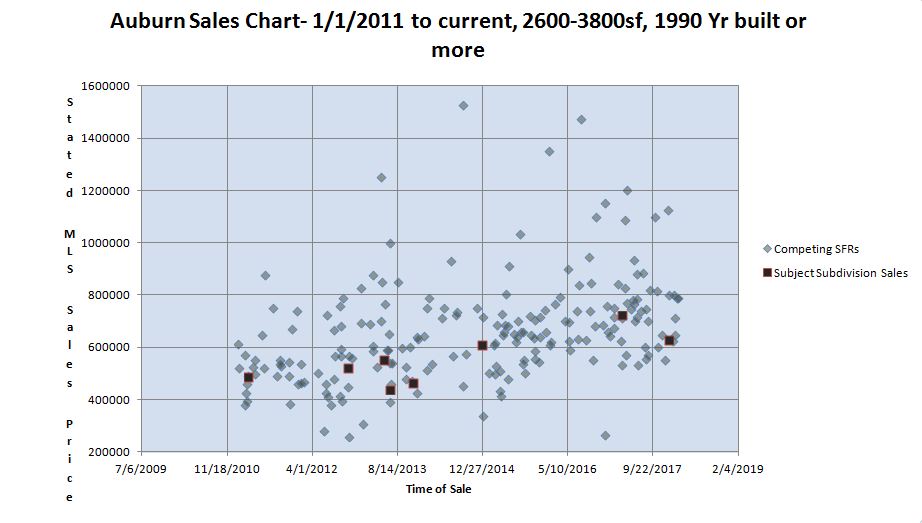
This graph shows Auburn sales after 1/1/2011, 2600-3800sf, 1990 year built or newer. I wanted to compare the subject’s subdivision which had limited sales over a large sample period to confirm how it compared to other market areas. When viewing, the subject’s subdivision generally followed the group sales as they trended upward. The graph also shows what sales trended above the subject’s subdivision sales to avoid using as comparables.

This graph followed the same concept as the first graph; however I used a 3 year time period and differentiated the square footage from 1,199sf and below vs. 1,200sf – 1,900sf. The subject property was about 1,500sf so wanted to accurately see the sales that competed in size. The graphs provide a nice visual showing the high and low of similar sized homes.

This last graph is a 1 year sales chart in the market area of Christian Valley/Meadow Vista/Colfax/Applegate/Weimar (area 12302/03). I wanted to compare 2 bedroom vs. 3 bedroom trends. Sometimes 2 bedroom homes have a den which can offset 3 bedroom home’s utility and at times skew the graph slightly, however it does paint a nice picture of 2 bedrooms generally trending lower than 3 bedroom homes. The subject property was a 2 BR and the client was a homeowner, so this can also help temper their expectation on market reaction when visually looking at a chart of 2 bedroom homes vs. 3 bedroom comparables.
Overall, these are some examples of how I’ve been utilizing graphs in my appraisal reports. There are some great tools available for us to utilize in our appraisal reports or if agents, in our CMA analysis to potential clients.
Office: 530-878-1688
Disclaimer: All information deemed reliable but not guaranteed. The information is meant entirely for educational purposes and casual reading only and is NOT intended for any other use. This information is NOT intended to support an opinion of value for your appraisal needs or any sort of value conclusion for a loan, litigation, tax appeal or other potential real estate or non real estate purpose. This appraiser is NOT a qualified home inspector and any tips are for informative purposes only. If you’d like to obtain and order an appraisal for your specific needs, please contact Bryan at 530-878-1688 for more information.
Annette Gregg
Posted at 10:11h, 11 MayThis is very useful information. Thank you for sending it. Have you ever thought of presenting this to a group of realtors? The PCAR (about 60 people) meeting in Auburn used to have an appraiser come in weekly to present this type of info. He retired recently and this group would love to have a new appraiser fill in the gap. Let me know if you are interested and I will arrange for you to meet the appropriate person at PCAR.
Annette Gregg, Realtor
Keller Williams
Bryan Lynch
Posted at 10:17h, 11 MayThanks Annette, Yes, I was friends with Don and aware of his retirement. Thanks for the thought- I’ll private message you.