24 Jan Inventory Increase – 4 Market Graphs and Sharing Tips!
We all generally know that the real estate market is slowing. But that statement alone is vague. As a professional, we need to know more specifics about our market to convey to our clients. Let’s take a closer look at some data.
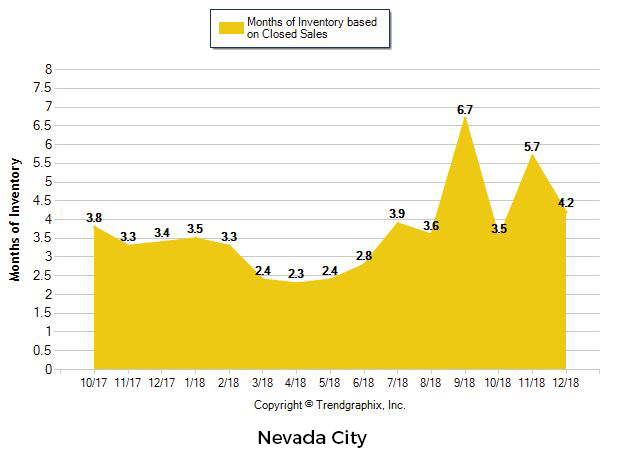
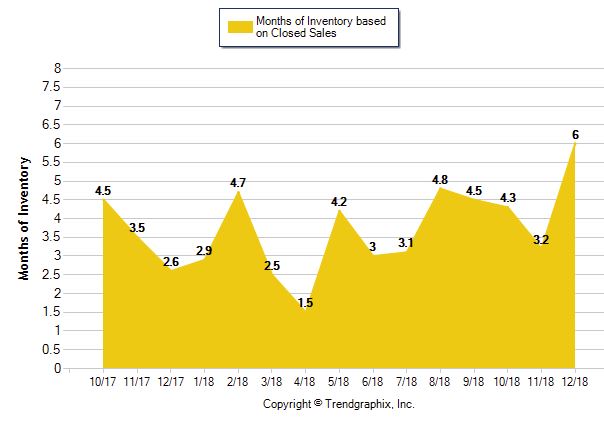
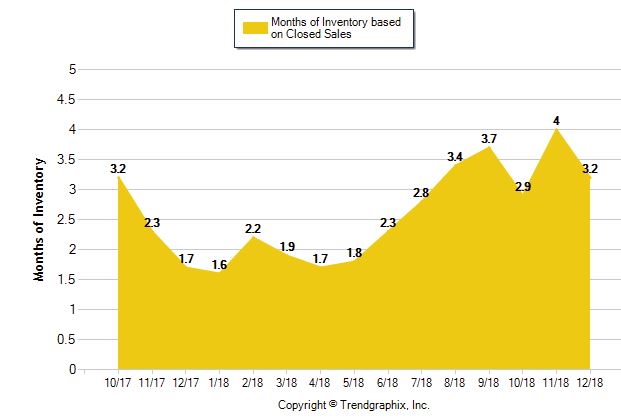
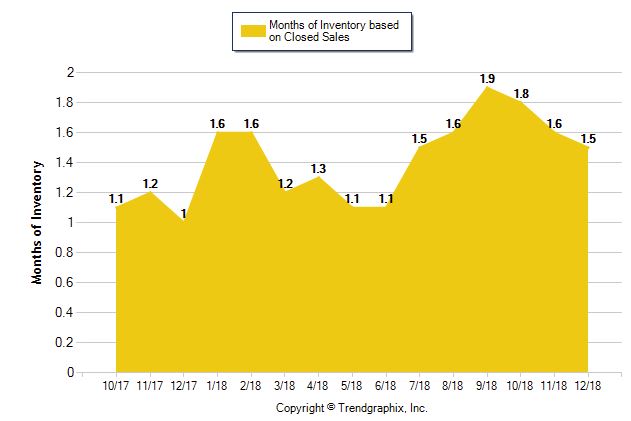
This is only one component to share, but graphs that show months of inventory compared to solds is a nice visual for a client. The 4 graphs show the market areas of Grass Valley/Alta Sierra, Nevada City, Auburn and Roseville. As the graphs demonstrate, all markets are increasing in inventory however at varying amounts.

Quick Overview- Shortage, Balance, Over-Supply
By definition, a shortage is 0-3 months of inventory. A balanced market is generally 3-6 months of inventory. An over-supply is 6+ months of inventory. So these charts are taking the number of active listings and dividing that figure by the total number of closed sales for the month.

Use the Graphs to show Clients the Trends
The MLS trend tool is a fantastic way to create a visual for your client to show them the market vs. telling them about it. For example, with Nevada City, the inventory graph shows that inventory has been steadily increasing since August and is in the balanced range.
Tip #1– Don’t get too caught up in data for one month as it may be skewed. Take a look at the overall picture.
Tip #2– Besides the graph, run data for different month increments to cross check. As a starting point, I like to run an area for 6 month and determine the total number of active listings, pending sales and closed sales for this time frame. Example: say there are 35 total active listings, 12 pending sales and 40 total sales over the last 6 months. Based on this, the market is in balance with approx. 5.25 months of inventory at this time (35 divided by 40 multiplied by 6).

Every Market is Different
The four graphs illustrate all 4 markets are slightly different.
Tip #1– It’s important to recognize that even though a market still may have a shortage of homes (Roseville), inventory is still increasing and the market may be slowing. Look at the days on market to cross check.
Tip #2- After running the data/graphs the entire market area (As I did in these 4 graphs), expand your graphs. Example: complete another graph with the comparable size range OR complete a graph with active listings vs. pending sales. With the market slowing, this may give us additional clues about the market direction. The trend tool allows you to modify the criteria easily.
Concluding, with the market slowing, we need to convey to our clients the specific details of the slow down. In both my lender and private appraisal work, I include many graphs in my reports to help tell the story of the changing market. I’m always available to talk about the market and bounce around what we are seeing on both sides of the fence (appraiser and realtor).
Bryan Lynch
Certified Real Estate Appraiser
Office: 530-878-1688
Bryanclynch@gmail.com
Roseville Office : Auburn Office
www.AdvantageAppraisalsCa.com
Disclaimer: All information deemed reliable but not guaranteed. The information is meant entirely for educational purposes and casual reading only and is NOT intended for any other use. This information is NOT intended to support an opinion of value for your appraisal needs or any sort of value conclusion for a loan, litigation, tax appeal or other potential real estate or non real estate purpose. This appraiser is NOT a qualified home inspector and any tips are for informative purposes only. If you’d like to obtain and order an appraisal for your specific needs, please contact Bryan at 530-878-1688 for more information.


Joe Lynch
Posted at 13:05h, 24 JanuaryHey Bryan,
Nice post. I agree that the Trend tool is invaluable for agents. I’m still surprised how few agents use it.
And Moving Pictures is clearly the best album of all time…..
Bryan Lynch
Posted at 13:08h, 24 JanuaryForget data talk, yes hard to disagree with Moving Pictures-Put it against any album and can’t lose! With the changing markets, agents should certainly learn how to incorporate.